More data are better data? Lost in a swarm of satellites
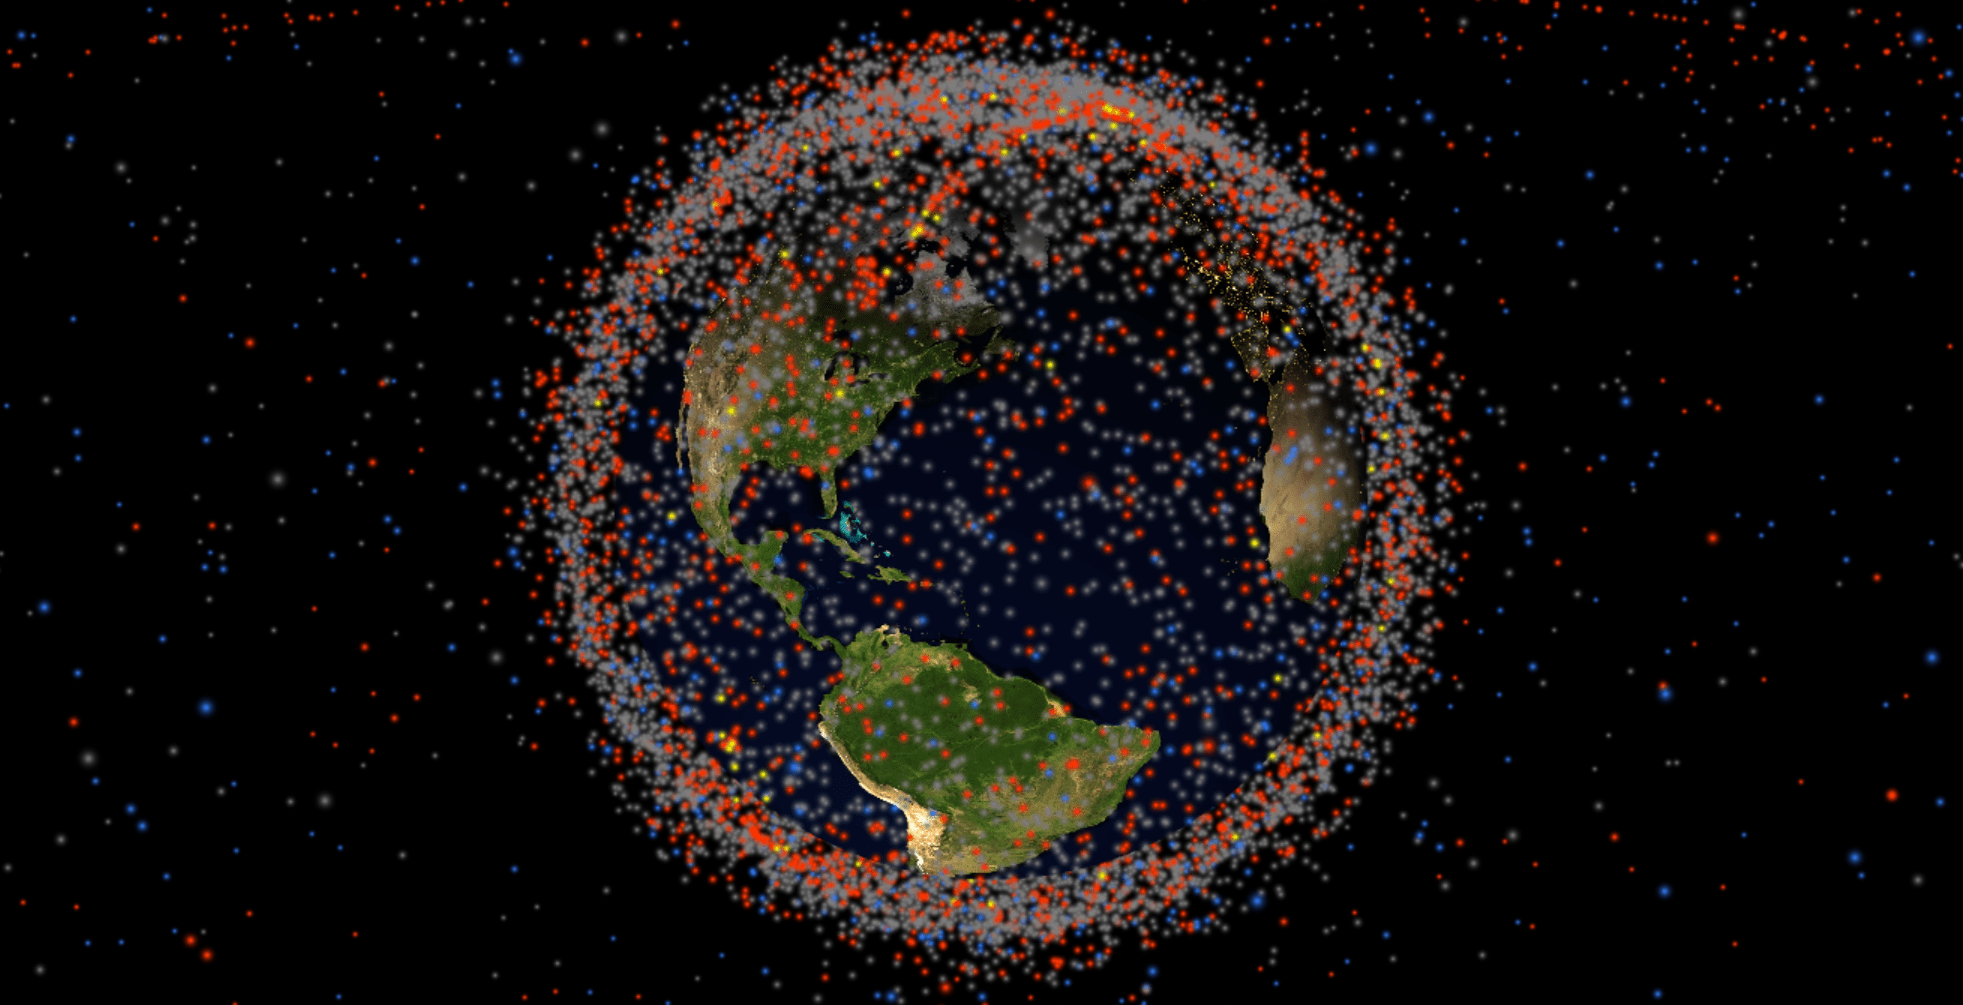
We live in the age of “big data” – an era of more and more numbers, matrices, and images becoming available to many people at increasing speed. And, we, as society, are incredibly good in building more and more algorithms and tools that produce even more data – data about nearly everything. In space, this has gone so far that our planet is orbited by a swarm of thousands of satellites. Space agencies and companies around the world have even more earth observation missions lurking in the pipeline. To get a glimpse of it, have a look at “Stuff in Space”, a real-time animation of objects surrounding the Earth.
Big data = answer to big questions?
So, what do we do now with all those big data sources that surround us? How can we use and combine satellite data for tackling the sustainability challenges of our time: climate and biodiversity crisis vs. providing resources for our growing world population? Simply put, how can we use the power of those “big” and diverse data sets to make a difference?
Let’s have a look at the topic of land use change, which is key for tackling some of those big challenges. Man-made land cover changes and land management might leave visible traces on land but can trigger invisible processes in the atmosphere with severe consequences. *Why we should care about land use change? Read about it in another blog post.
From satellite swarms to maps as storytellers
And where do satellites come in now? Earth observation satellites receive electromagnetic signals from the land surface, which are then classified and converted into maps. Used as time series, they can reveal processes of land use/cover change, help us understand and learn from the past.
Top 5 satellite data sets for exploring land change
Here comes a check list of the top 7 open, satellite-based land cover/use maps including their pros and cons for exploring global land change processes:
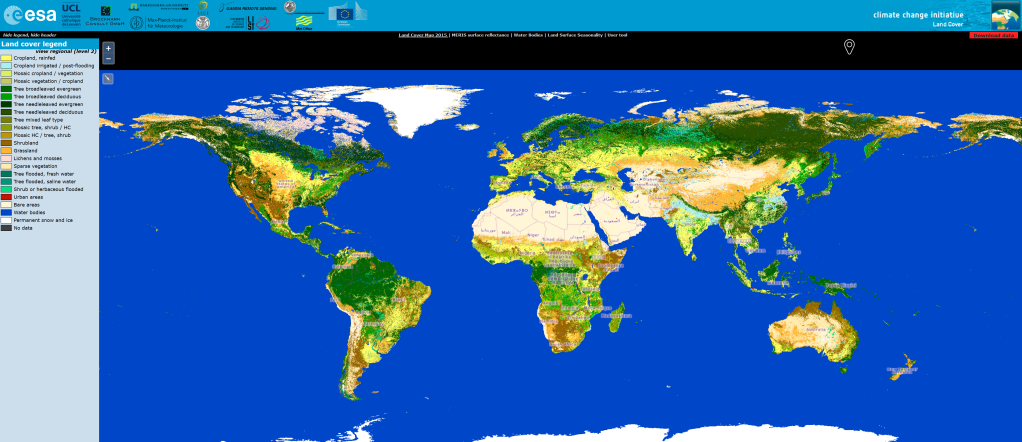
1. ESA CCI Land Cover
http://maps.elie.ucl.ac.be/CCI/viewer/index.php
ESA CCI Land Cover land cover maps were generated from the full archives of 300 m MERIS (Envisat satellite), 1 km SPOT-VEGETATION, 1 km PROBA-V and 1 km AVHRR (NOAA satellites) systems.
Pro
Con
- consistent time series of 1992-2015
- long temporal coverage
- spatial resolution of 300 m
- thematic detail: 22 land cover categories
- non-explicit “mosaic” land cover categories
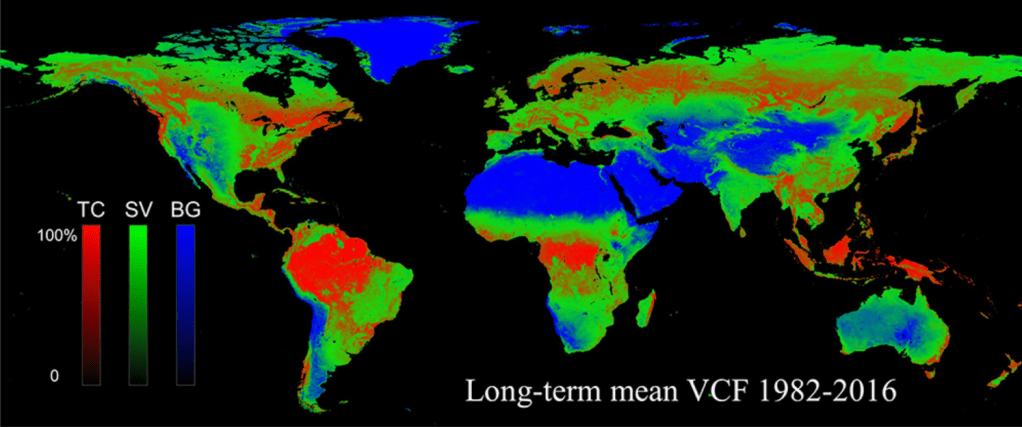
2. GLAD UMD Global Land Cover Change VCF
https://glad.umd.edu/dataset/long-term-global-land-change
Vegetation continuous fields (VCF) represent land surface as a fractional combination of vegetation functional types that can be remotely sensed from satellites. The maps were obtained from NOAA/AVHRR satellite and consist of tree canopy (TC) cover, short vegetation (SV) cover and bare ground (BG) cover over the past 35 years (1982-2016).
Song, X.P., Hansen, M.C., Stehman, S.V., Potapov, P.V., Tyukavina, A., Vermote, E.F., & Townshend, J.R. (2018). Global land change 1982-2016. Nature 560, 639–643.
Pro
Con
- consistent time series of 1982-2016
- long temporal coverage
- within pixel information: area fractions
- spatial resolution of 0.05°×0.05°
- thematic detail: 3 land cover categories only
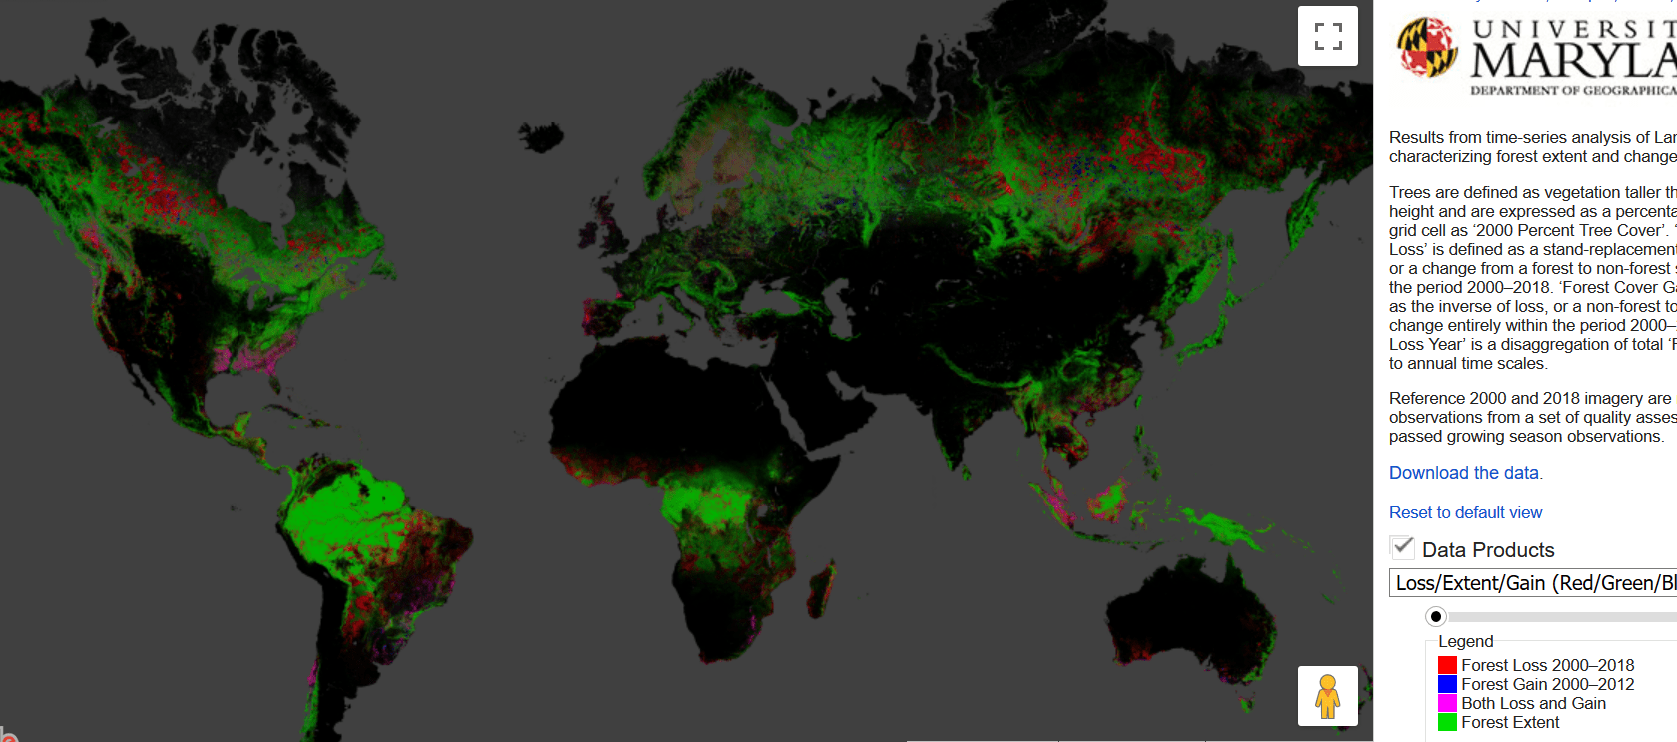
3. Hansen et al. (2013) Global Forest Change
https://earthenginepartners.appspot.com/science-2013-global-forest
The Global Forest Change map was derived from Landsat satellite images (30 m resolution) and contains tree cover in percentage, the year of forest loss during 2000-2018 and areas of forest gain during 2000-2012.
Hansen, M. C., P. V. Potapov, R. Moore, M. Hancher, S. A. Turubanova, A. Tyukavina, D. Thau, S. V. Stehman, S. J. Goetz, T. R. Loveland, A. Kommareddy, A. Egorov, L. Chini, C. O. Justice, and J. R. G. Townshend. 2013. High-Resolution Global Maps of 21st-Century Forest Cover Change. Science 342 (15 November): 850–53.
Pro
Con
- spatial resolution of 30 m: high spatial detail
- consistent time series of 2000-2018
- differing units and reference periods (tree cover in area percentage, 2000; forest loss in years, 2000-2018; forest gain in binary classes 2000-2012)
- short temporal coverage
- thematic detail: only tree cover/forest-related
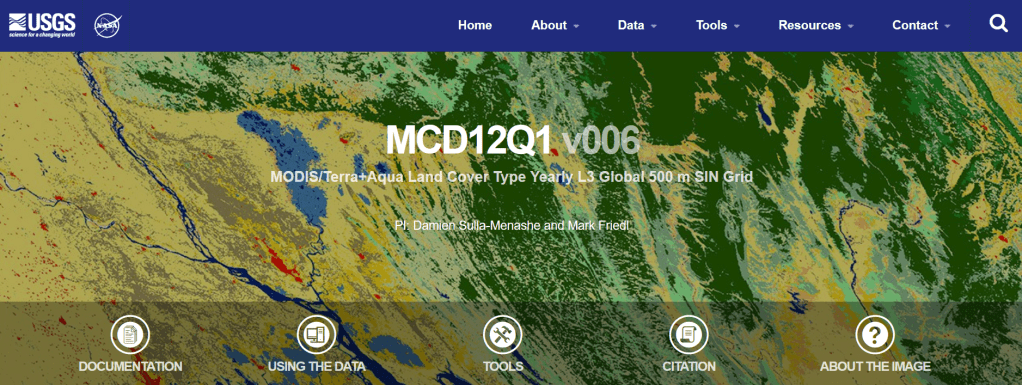
4. MODIS Land Cover MCD12Q1
https://lpdaac.usgs.gov/products/mcd12q1v006/
The yearly Moderate Resolution Imaging Spectroradiometer (MODIS) Land Cover Type (MCD12Q1) maps were classified from Terra and Aqua satellite imagery from 2001-2018.
Friedl, M., D. Sulla-Menashe. MCD12Q1 MODIS/Terra+Aqua Land Cover Type Yearly L3 Global 500m SIN Grid V006. 2019, distributed by NASA EOSDIS Land Processes DAAC, https://doi.org/10.5067/MODIS/MCD12Q1.006. Accessed 2019-11-13.
Pro
Con
- consistent time series of 2001-2018 with updates
- quality information
- different land cover classification systems
- spatial resolution of 500 m
- short temporal coverage
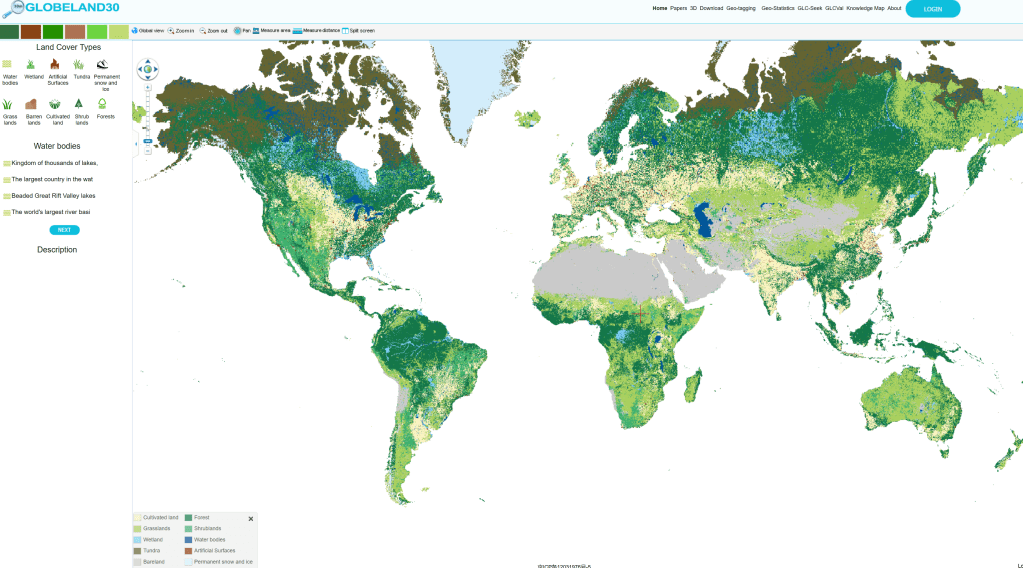
5. Globeland30
http://www.globeland30.org/GLC30Download/index.aspx
The Globeland30 data set was generated at the National Geomatics Center of China (NGCC) from Landsat satellite images at 30 m resolution and auxiliary data (e.g. land cover, elevation, vegetation indices) for reference years 2000 and 2010. The maps contain 10 land cover types.
Chen J., Ban Y., Li S. China: Open access to Earth land-cover map[J]. Nature, 2014, 514(7523): 434-434. DOI:10.1038/514434c.
Pro
Con
- spatial resolution of 30 m: high spatial detail
- claimed open access, but acquisition barriers (personal request per mail after several download attempts, Jan 2019)
- spatial shift between maps: low consistency
- two years only
- coarse thematic detail of land cover categories
Note that this ranking of land cover data sets represents my personal view as a user of Open Data for analysing changes on the land surface.
